Infrastructure monitoring with grafana and friends
Published on Tuesday, 02 February, 2021Table of content
Intro
In this guide we will look into how to configure infrastructure monitoring using the Grafana. Besides grafana itself, we'll use prometheus for metrics aggregation, node_exporter for log collection, loki for log agregation and promtail for log collection.
For this one you will obviously need podman. If you are (like me in this case) doing this on centOS or similar machine, getting podman is as simple as:
# dnf install podman
If you are on some other distro, it shouldn't be that complicated.
Now that we have podman let's talk about what exactly we are doing. We want to achieve following:
- collect metrics from local and remote machines
- collect logs from local and remote machines
- display everything in pretty dashboards
For those who are not familiar, let's go through each component.
grafana is a web dashboard for visualizing data. It's most commonly used to visualize different metrics.
prometheus is a monitoring system with time series database and alerting capabilities.
node_exporter is one of many metrics exporters for prometheus, in this case exporting the metrics of node it's running on.
loki is a log aggregation system inspired by prometheus.
promtail is an agent to collect logs and send them to loki.
With all this out of our way, let's get started.
Creating configuration files
Not unlike last time, we build a simple folder structure to keep all the files:
/containers
└── run
    ├── grafana
    ├── loki
    └── prometheus
So there is containers folder in root of the filesystem, that holds runtime files for our containers. We don't need to build any containers, we'll use upstream for all our needs.
grafana
The grafana config resides in following folder structure:
grafana
├── etc
│   └── grafana
│       └── provisioning
│           ├── dashboards
│           ├── datasources
│           ├── notifiers
│           └── plugins
└── var
    └── lib
        └── grafana
To create it, run following commands:
# mkdir -p /containers/run/grafana/etc/grafana/provisioning/{datasources,plugins,notifiers,dashboards}
# mkdir -p /containers/run/grafana/var/lib/grafana
Here, we will keep both configuration and persistent data. To begin, let's grab the default config from git:
# cd /containers/run/grafana/etc/grafana
# wget https://raw.githubusercontent.com/grafana/grafana/master/conf/sample.ini -O grafana.ini
We will be running the container with user 2012 so let's change the ownership of that folder structure:
# chown -R 2012 /containers/run/grafana
We can now modify the config to suit our needs, since this is not a production, we won't change much or worry too much about security. We'll do the following:
[server]

# The public facing domain name used to access grafana from a browser
domain = grafana.domain.tld

# Redirect to correct domain if host header does not match domain
# Prevents DNS rebinding attacks
enforce_domain = true

[security]

# default admin password, can be changed before first start of grafana,  or in profile settings
admin_password = YOUR_STRONG_PASSWORD

[log]

# Either "console", "file", "syslog". Default is console and  file
# Use space to separate multiple modes, e.g. "console file"
mode = console
You should by now have a dns server, so add an entry for grafana and fill in the domain in config. We'll force the redirect for good measure. Under security configure the admin password. Since this runs within container we don't want it to write logs to disk, so we'll change the log mode to console only.
You can look through the config and change whatever else you feel is important.
node_exporter
Before starting to configure prometheus, let's figure what data we want to collect. Since we want to monitor some kind of IT infrastructure, let's assume that we are interested in node metrics. To get the data into prometheus, we need some kind of exporter. To have some kind of data within pormetheus, let's get the metrics from our container host.
Let's add the ibotty/prometheus-exporter repo and install the node_exporter package:
# curl -Lo /etc/yum.repos.d/_copr_ibotty-prometheus-exporters.repo https://copr.fedorainfracloud.org/coprs/ibotty/prometheus-exporters/repo/epel-8/ibotty-prometheus-exporters-epel-8.repo
# dnf install node_exporter
Once installed, we can run and enable the service:
# systemctl start node_exporter
# systemcrl enable node_exporter
We can check if everything is okay by running:
# curl localhost:9100/metrics
# HELP go_gc_duration_seconds A summary of the GC invocation durations.
# TYPE go_gc_duration_seconds summary
go_gc_duration_seconds{quantile="0"} 0
go_gc_duration_seconds{quantile="0.25"} 0
go_gc_duration_seconds{quantile="0.5"} 0
go_gc_duration_seconds{quantile="0.75"} 0
go_gc_duration_seconds{quantile="1"} 0
go_gc_duration_seconds_sum 0
go_gc_duration_seconds_count 0
# HELP go_goroutines Number of goroutines that currently exist.
# TYPE go_goroutines gauge
...
And a lot more metrics from the node.
prometheus
Now that we have some data to work with, let's get it into prometheus. As usual we'll start with desired folder structure:
prometheus
├── etc
│   └── prometheus
├── prometheus
│   └── data
└── var
    └── lib
        └── prometheus
To create it, run:
# mkdir -p /containers/run/prometheus/etc/prometheus
# mkdir -p /containers/run/prometheus/prometheus/data
# mkdir -p /containers/run/prometheus/var/lib/prometheus
Here, we will provide very simple config for prometheus to scrape the local machine in etc/prometheus/prometheus.yml:
# A scrape configuration scraping a Node Exporter and the Prometheus server
# itself.
global:
  scrape_interval: 5s
scrape_configs:
  # Scrape Prometheus itself every 5 seconds.
  - job_name: 'prometheus'
    static_configs:
      - targets: ['localhost:9090']  # Scrape the Node Exporter every 5 seconds.
  - job_name: 'containers.domain.tld'
    static_configs:
      - targets: ['192.168.122.254:9100']
With this config, prometheus will collect metrics for itself, and for the container node it's running on. Notice that since prometheus is running within container, we can't scrape the node config on localhost, but have to use the IP address of the host.
Just fix the permissions:
chown -R 2011 /containers/run/prometheus
And we are done with prometheus config.
loki
As usual, first we need a folder structure to hold all the data and config, for loki it looks like this:
loki
├── etc
│   └── loki
└── loki
And we can create it by running:
# mkdir -p /containers/run/loki/etc/loki
# mkdir -p /containers/run/loki/loki
We can get the default config from git:
# cd /containers/run/loki/etc/loki
# wget https://raw.githubusercontent.com/grafana/loki/master/cmd/loki/loki-local-config.yaml
The only thing we'll change inside is the location where loki will store chunks:
storage_config:
  # ...
  filesystem:
    directory: /loki/chunks
Changing it from /tmp/loki/chunks to /loki/chunks.
The only thing left to do is to fix the ownership of the folder:
chown -R 2013 /containers/run/loki
promtail
Unlike prometheus which scrapes the metrics endpoints, loki needs logs pushed into it. For that role we'll use promtail. Since we'll push logs from host, we'll install it on our container host and configure to push logs to loki.
Promtail ships as a single binary, so we can download it from directly from github. Let's download the package and put it in /usr/local/bin:
# cd /usr/local/bin
# wget https://github.com/grafana/loki/releases/download/v2.1.0/promtail-linux-amd64.zip
# unzip promtail-linux-amd64.zip
# mv promtail-linux-amd64 promtail
# rm promtail-linux-amd64.zip
Next, let's create an user that will run promtail:
# useradd --system promtail
# usermod -aG systemd-journal promtail
We have added the user to systemd-journal group, so it will be able to read journal and send it to loki.
Next, we will create the config folder:
# mkdir /etc/promtail
And add congig in /etc/promtail/promtail-local-config.yaml
server:
  http_listen_port: 9080
  grpc_listen_port: 0

positions:
  filename: /tmp/positions.yaml

clients:
  - url: http://127.0.0.1:3100/loki/api/v1/push

scrape_configs:
- job_name: journal
  journal:
    max_age: 12h
    labels:
      job: systemd-journal
  relabel_configs:
    - source_labels: ['__journal__systemd_unit']
      target_label: 'unit'
The config is fine for our needs, it reads systemd journal and pushes it to localhost on port 3100.
Let's create a systemd service file for promtail in /etc/systemd/system/promtail.service:
[Unit]
Description=Promtail service
After=network.target

[Service]
Type=simple
User=promtail
ExecStart=/usr/local/bin/promtail -config.file /etc/promtail/promtail-local-config.yaml

[Install]
WantedBy=multi-user.target
And finally update the systemd daemon files:
# systemctl daemon-reload
Podman
At last, it's time to create and start the pod. To create pod run:
# podman pod create --name mon -p '127.0.0.1:9090:9090/tcp' -p '127.0.0.1:3000:3000/tcp' -p '127.0.0.1:3100:3100/tcp'
For a tiniest bit of theory you can check last post.
We are running three containers within mon pod, and we map the ports for grafana (3000/tcp), prometheus (9090/tcp) and loki (3100/tcp). All of them are mapped to localhost, so we will need some kind of proxy in front which we'll do later with NGINX.
First, create and start grafana:
# podman run -d --name grafana --pod mon -v '/containers/run/grafana/var/lib/grafana:/var/lib/grafana:Z' -v '/containers/run/grafana/etc/grafana:/etc/grafana:Z' --user 2012 grafana/grafana
If we try to connect to it:
# curl localhost:3000
<a href="http://grafana.domain.tld:3000/">Moved Permanently</a>.
We see that we are redirected to grafana.domain.tld, so grafana is running and our config is used.
Next, lets do prometheus:
podman run -d --name prometheus --pod mon -v '/containers/run/prometheus/var/lib/prometheus:/var/lib/prometheus:Z' -v '/containers/run/prometheus/prometheus:/prometheus:Z' -v '/containers/run/prometheus/etc/prometheus:/etc/prometheus:Z' --user 2011 prom/prometheus --config.file=/etc/prometheus/prometheus.yml --web.route-prefix=/ --storage.tsdb.retention.time=200h --web.enable-lifecycle
And again, running:
# curl localhost:9090
<a href="/graph">Found</a>.
Shows us that something is running on that port (spoiler: it's prometheus).
And last one, loki:
# podman run -d --name loki --pod mon -v '/containers/run/loki/loki:/loki:Z' -v '/containers/run/loki/etc/loki:/etc/loki:Z' --cpus=1 --user 2013 grafana/loki -config.file=/etc/loki/loki-local-config.yaml
And after a few moments we can check:
# curl localhost:3100/ready
ready
Telling us that loki is ready to receive data.
Web access
At this point you should have a dns server with custom domain. Add the entries for our services to your dns:
grafana.domain.tldprometheus.domain.tldloki.domain.tld
Also, you should have NGINX installed. If not, simply run:
# dnf install nginx
And don't forget SELINUX if you have it enabled:
# setsebool -P httpd_can_network_connect 1
Once everything is prepared, create configs new virtual hosts in /etc/nginx/conf.d/.
grafana.conf for grafana:
server {
  listen 192.168.122.254:80;
  server_name grafana.domain.tld;
  root /usr/share/nginx/html;
  index index.html index.htm;

  location / {
   proxy_pass http://127.0.0.1:3000/;
   proxy_set_header Host $host;
  }

  access_log /var/log/nginx/grafana.access.log;
  error_log /var/log/nginx/grafana.error.log;
}
prometheus.conf for prometheus:
server {
  listen 192.168.122.254:80;
  server_name prometheus.domain.tld;
  root /usr/share/nginx/html;
  index index.html index.htm;

  location / {
   proxy_pass http://127.0.0.1:9090/;
   proxy_set_header Host $host;
  }

  access_log /var/log/nginx/prometheus.access.log;
  error_log /var/log/nginx/prometheus.error.log;
}
And, you guessed it, loki.conf for loki:
server {
  listen 192.168.122.254:3100;
  server_name loki.domain.tld;
  root /usr/share/nginx/html;
  index index.html index.htm;

  location / {
   proxy_pass http://127.0.0.1:3100/;
   proxy_set_header Host $host;
  }

  access_log /var/log/nginx/loki.access.log;
  error_log /var/log/nginx/loki.error.log;
}
If you are following carefully, you will notice that loki is running on port 3100, and if you have any experience with SELINUX you'll know that it loves to complain, so let's fix it by adding port 3100 to list of http ports in http_port_t variable:
# semanage port -a -t http_port_t -p tcp 3100
And now we can (re)start and enable NGINX:
# systemctl restart nginx
# systemctl enable nginx
There is one last obstacle before we can connect to our services, the firewall:
# firewall-cmd --add-service=http --permanent
# firewall-cmd --add-service=https --permanent
# firewall-cmd --add-port=3100/tcp --permanent
# firewall-cmd --reload
At this point we should be able to access all our services. So let's do some exploration and configuration.
prometheus
Go to http://prometheus.domain.tld in your browser, then in menu choose Status and Targets. You should see something similar to this:
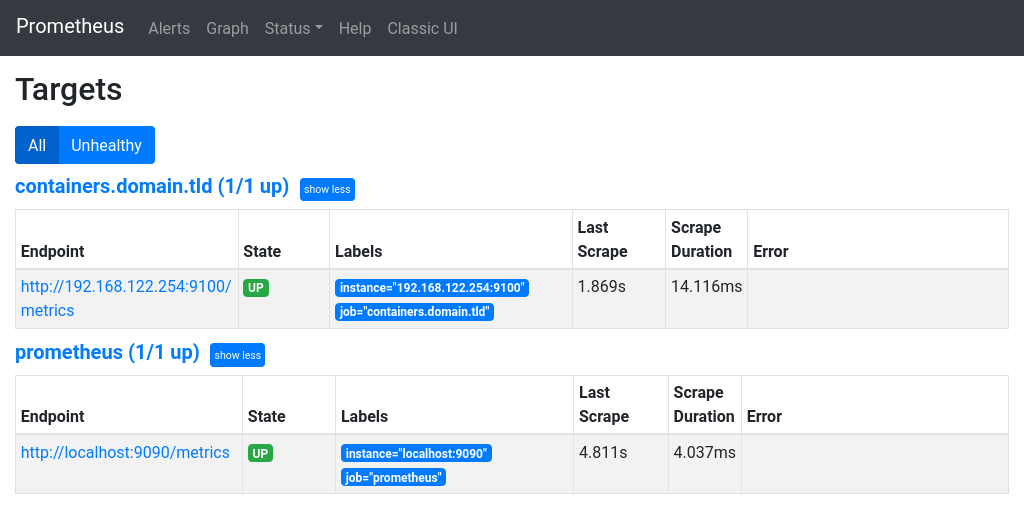
Make sure everything is UP and there are no errors.
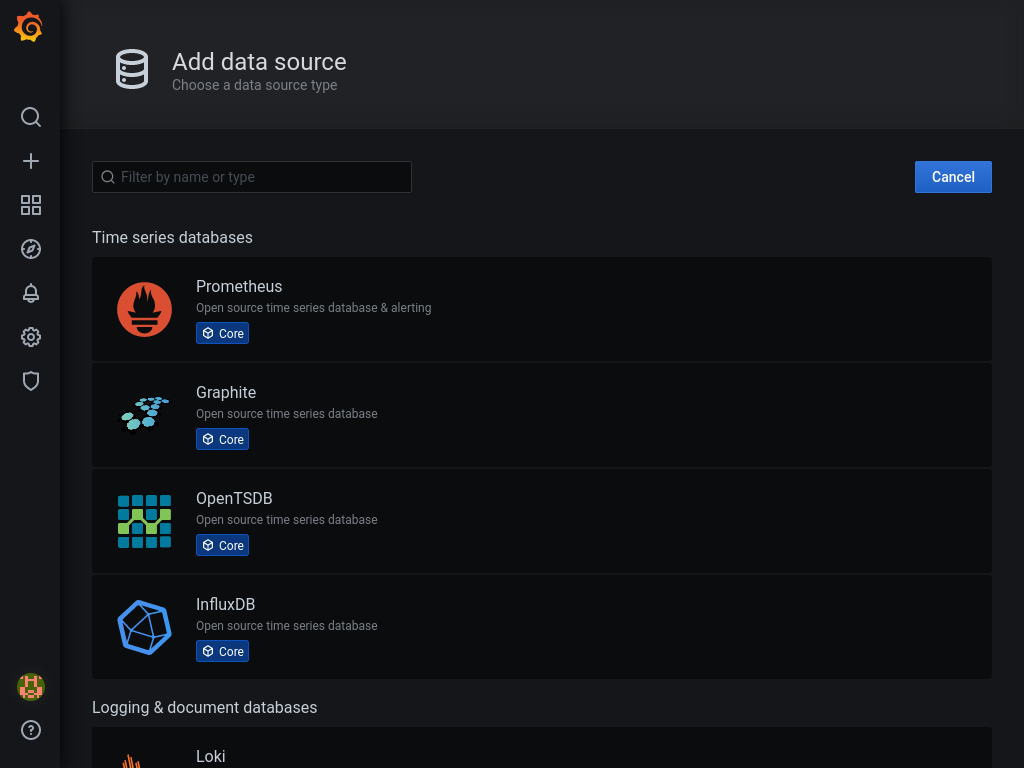
gafana metrics
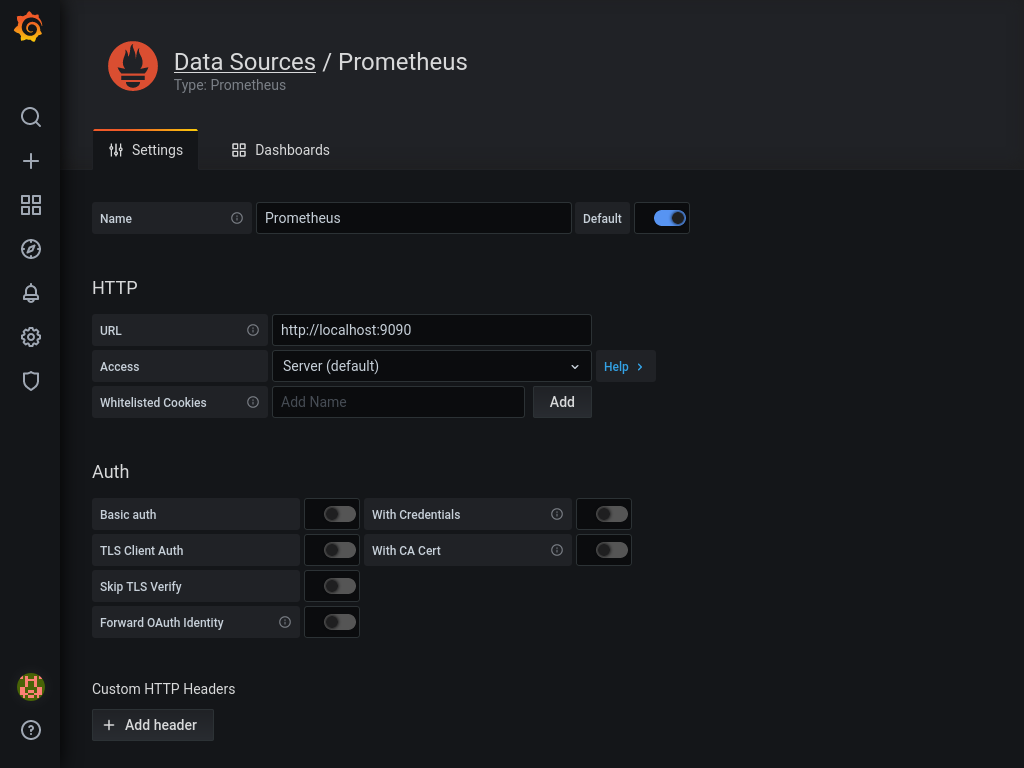
Now that we know that prometheus is collecting metrics, let's see some visualizations in grafana. Go to http://grafana.domain.tld/datasources/new, login and choose prometheus.
Enter http://localhost:9090 as URL and click Save & Test at the bottom of the page.
Next, hop to http://grafana.domain.tld/dashboard/import.
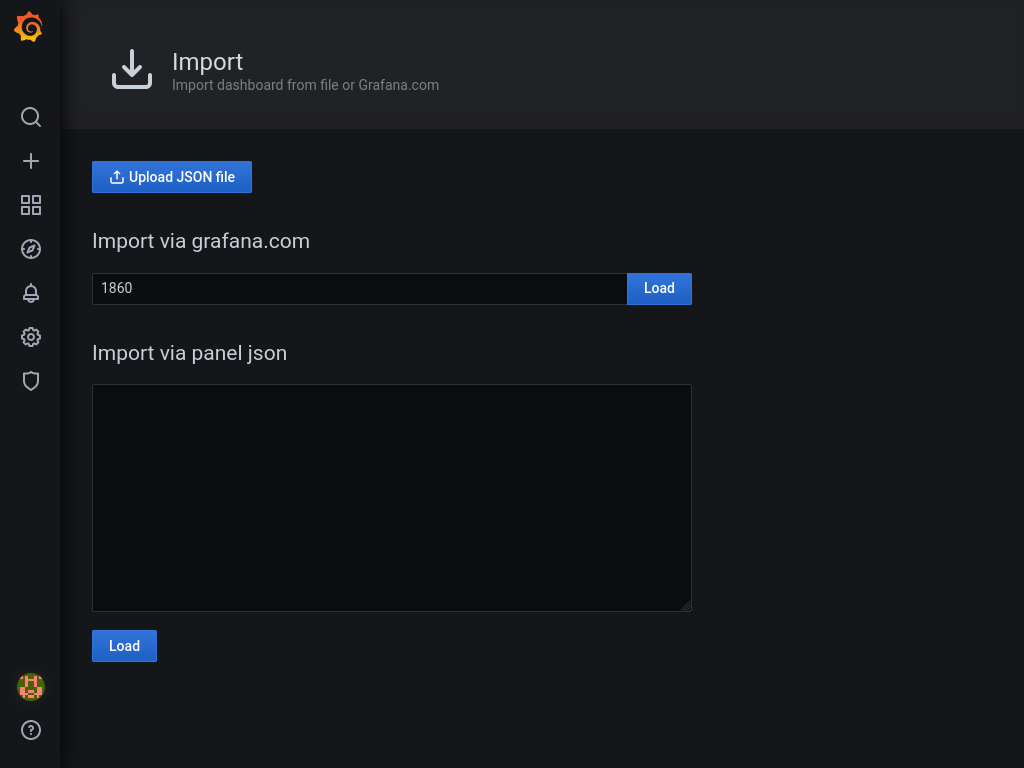
Enter 1860 as dashboard id, and press load. On the next screen select our (only) prometheus as data source, and press Import. You should be revarded with a dashboard similar to one on the picture below.
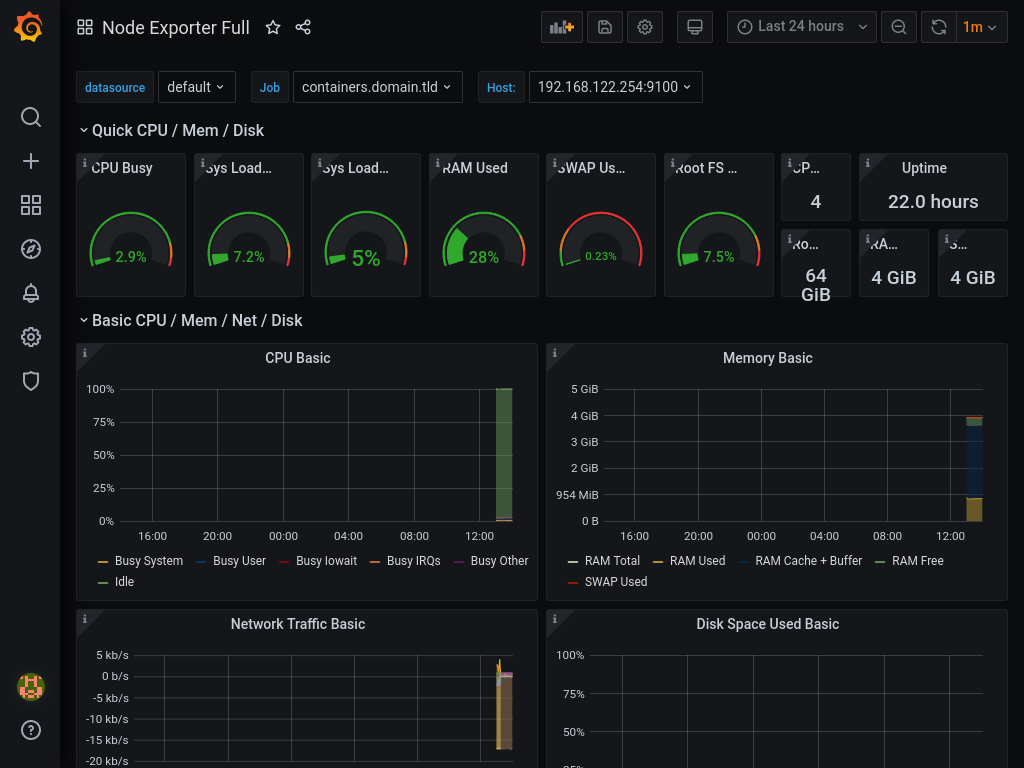
You can now start exploring what kind of exporters and dashboards are availalbe for prometheus and grafana.
loki
Now that we have some metrics, let's tackle the logs. If you remember we have added the promtail to our node, but we never started it, so let's do that now:
# systemctl start promtail
# systemctl enable promtail
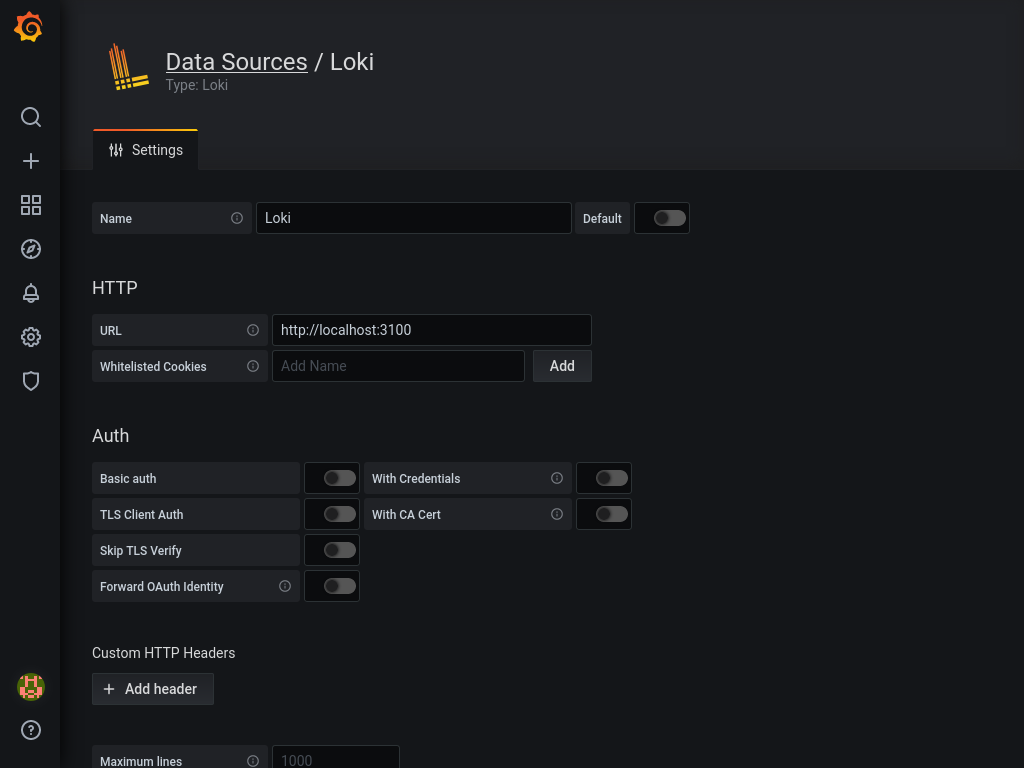
With that sorted, let's turn to loki. To see what data we have in loki, we'll again use grafana. Add another source in grafana by visiting http://grafana.domain.tld/datasources/new again. But this time choose Loki and set http://localhost:3100 as URL, save with Save & Test at the bottom.
Unfortunately i haven't found any nice dashboards to show data from loki, however, if you visit http://grafana.domain.tld/explore and choose Loki as source, you can query all logs shipped to loki. If you search for {job="systemd-journal"}, you'll see everything currently in loki.
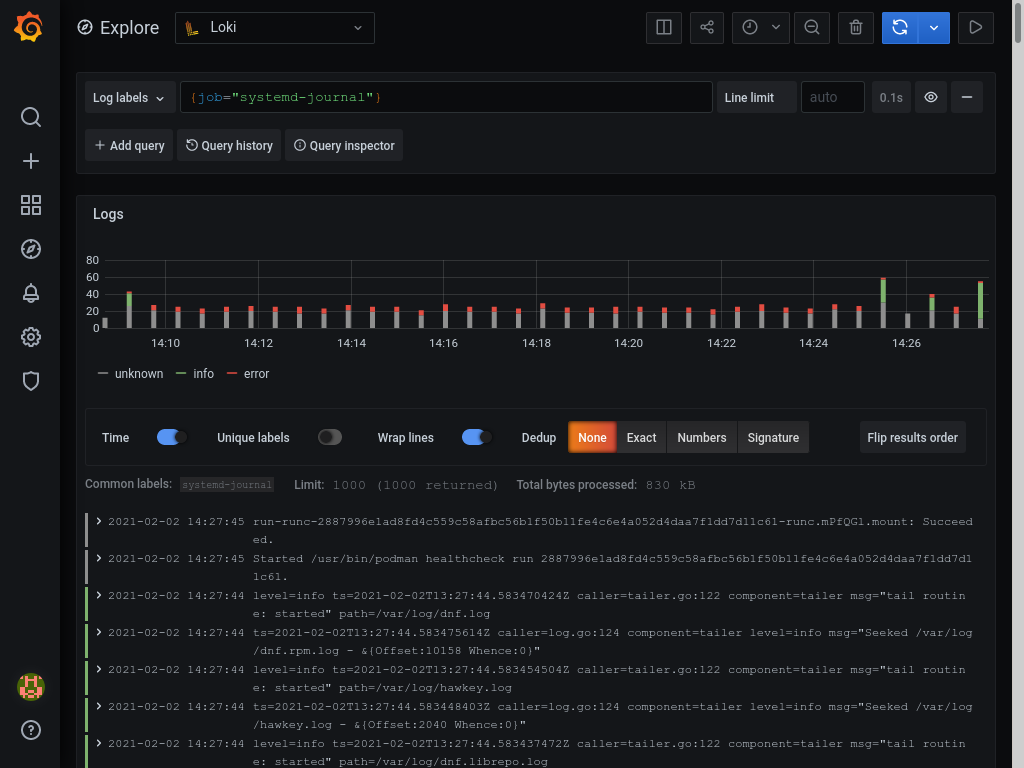
You can of course play around with creating different queries or creating a custom dashboard to suit your needs. You can also add other logs to promtail and add them to loki.
This concludes this part of infrastructure monitoring, but there is much more to be done in future.